We're Sequin, a Postgres CDC tool to streams and queues like Kafka, SQS, HTTP endpoints, and more. Before that, the team was working on another infrastructure company, where we used Elixir's Observer heavily. We loved it so much, that we built an observe for our message stream.
We recently experienced some puzzling runtime characteristics: our machine reported a high load average but only moderate CPU utilization. All cores on our machine were evenly utilized, consistently at about 40%. Nonetheless, our performance benchmarks degraded – the machine felt overloaded. We turned to Observer to figure out why.
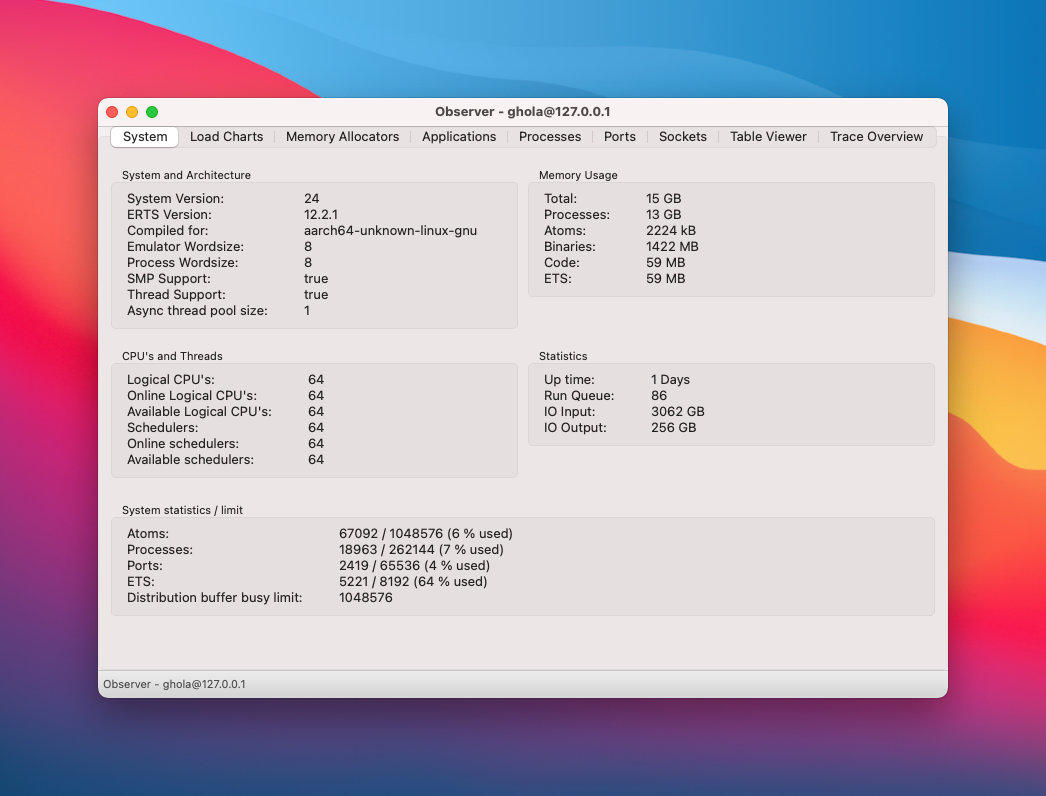
Observer is a great diagnostic tool for Elixir/Erlang applications. It's like Activity Monitor or htop for the BEAM. You can see the overall health stats of a running node, understand how cores are being utilized by the scheduler, and drill down to individual processes to see if anything is amiss:

Observer has a lot of functionality, but this post will focus on the parts we found most helpful in our investigation.
Investigation
To understand the insights Observer is presenting, you'll need to know a little about the Elixir/Erlang runtime. So I'll switch between describing properties of the Erlang VM (the BEAM) and how Observer helps you inspect them.
We'll start with the fundamentals of the BEAM: processes and schedulers.
Processes and schedulers
Erlang was built from the ground up to support tremendous concurrency. Erlang processes are lightweight and fast to create and terminate – they can send messages to one another, but each has its own isolated memory. Processes are managed by the BEAM, not the underlying operating system.
The BEAM boots a scheduler for each core on its host machine. A scheduler distributes "air time" on a CPU core among processes. If you have ten processes running CPU-intensive tasks on a single-core machine, the scheduler will distribute CPU core time between them: it will allow Process A to run for a bit, then interrupt it to give Process B a little time, and so on.
Naturally, if you run those same 10 processes on a multi-core machine, the work will be distributed among those cores evenly.
Utilizing all cores efficiently is half the motivation for using processes. The other half is I/O. A process waiting on an I/O operation – say, a request to a remote webserver – uses almost no resources (outside its memory allocation) while it waits for a response.
The run queue
The "System" tab is the first one you see after launching Observer:

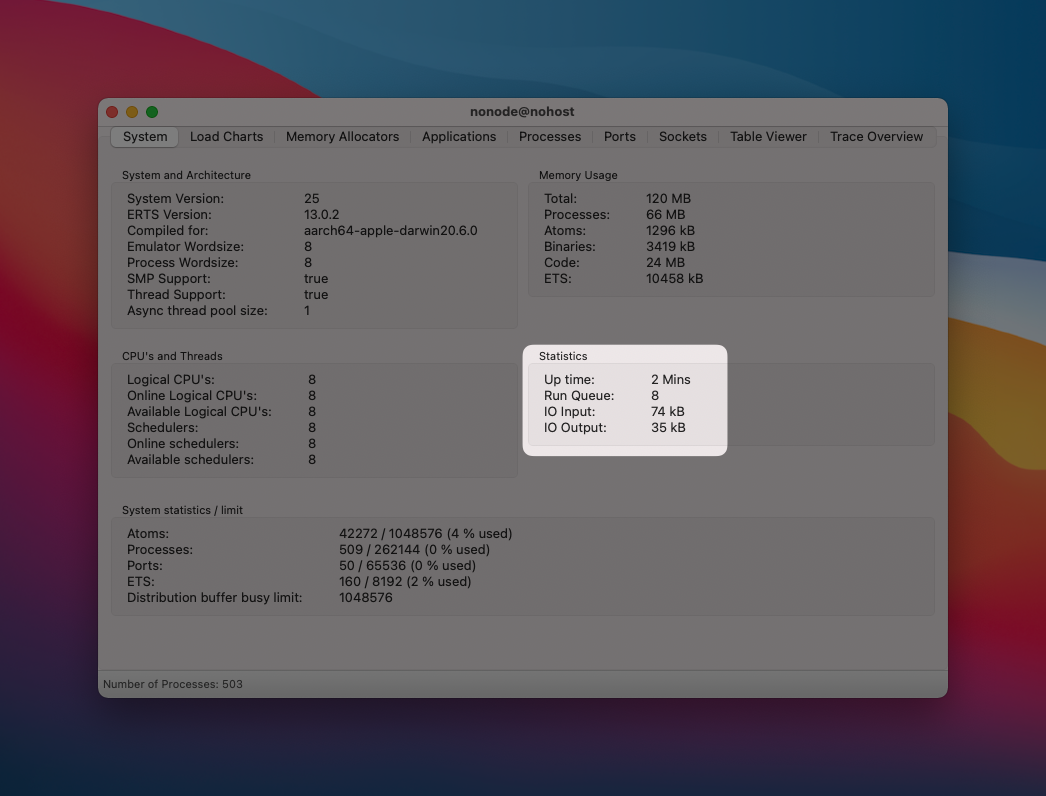
This tab shows you memory usage, helpfully broken out between things like processes and binaries (strings). Of most interest to us was the "Run Queue" stat.
When a process needs CPU time but can't be scheduled immediately, it enters its scheduler's run queue.
An item is in the run queue because you have more work than you have CPUs to do it. In our previous example of a single-core machine with a single scheduler juggling 10 CPU-intensive processes, the run queue would be pegged at 9: there are 9 processes that want CPU time, but are awaiting their turn because there aren't any idle cores.
You can test this for yourself. On my computer, I popped open iex and defined this recursive function which performs a CPU-intensive task:
defmodule A do
  # define a module function, which can call itself recursively
  def gen_recursive do
    :public_key.generate_key({:rsa, 4096, 65537})
    gen_recursive()
  end
end
Then I ran the following loop to spawn twice as many processes as I have cores. System.schedulers_online is a helper function that returns how many cores are available to the BEAM:
for _n <- 1..(System.schedulers_online * 2) do
  # spawn_link/1 starts a new process
  spawn_link(fn -> A.gen_recursive() end)
end
With those processes booted, I ran :observer.start. I have 8 cores on my machine but there are 16 CPU-intensive processes running, all vying for CPU time. At any give time, there are 8 in the run queue:

José Valim, Elixir's creator, confirms you want to keep this number very low, like below half your CPU core count. A longer run queue indicates your machine can't keep pace with all the work you're trying to do.
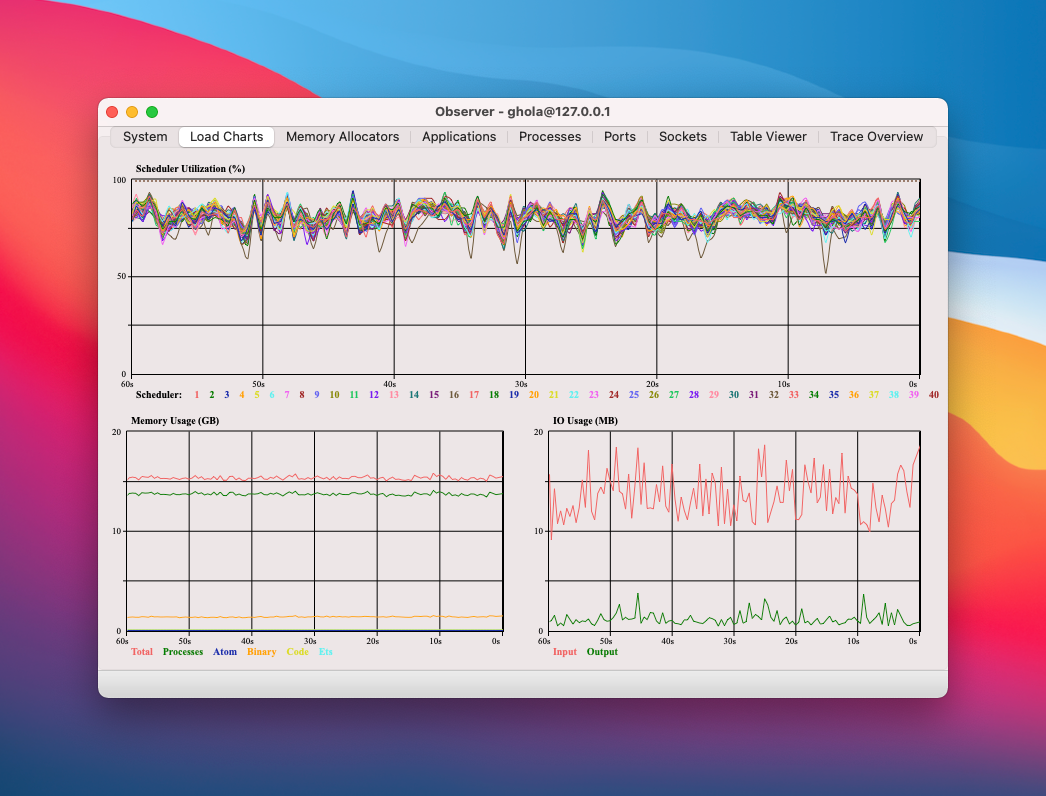
Take a look at how the "Load Charts" tab in Observer looked during our investigation. Our CPU cores aren't working at capacity, but the schedulers are reporting they are completely busy:

The combination of a high run queue and high scheduler utilization confirmed our suspicions: Sequin's machine was overloaded.
Even so, instead of just throwing more resources at our application, we wanted to understand more about why the machine was overloaded. We dug deeper into Observer. The "Processes" tab proved instrumental.
Optimizing processes
The "Processes" tab lists all processes running on the node. For each process on this tab, you can see these high-level attributes:
Reductions
You can sort processes by reductions, or the number of function calls that have happened inside the process. This may tell you if a particular process/module is overactive. For us, reductions didn't reveal anything unexpected.
Memory
Next, you can sort by memory usage (in bytes) to get a sense of which processes hog or leak it. The beautiful part about the BEAM is that once you have a process in your sights, you can easily dig in deeper to figure out what's amiss.
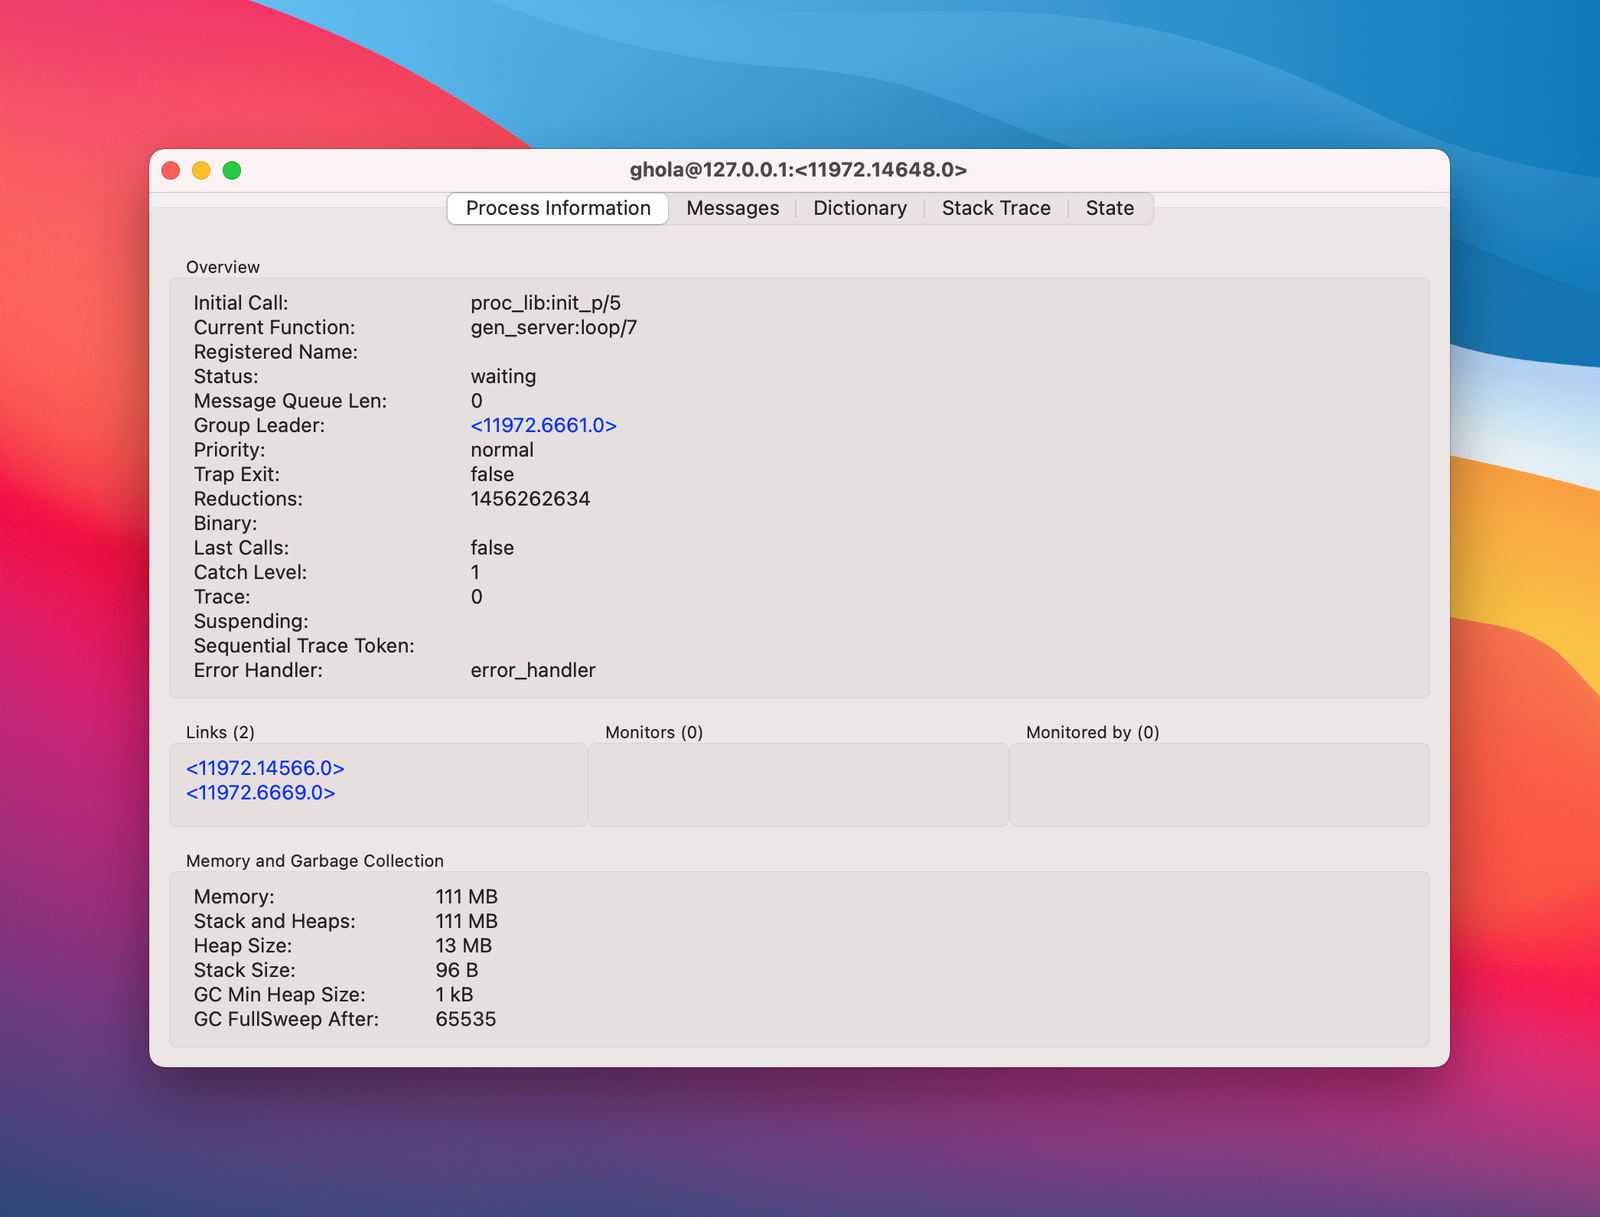
You can right click on a process and pull up its process info:

This gives us a little more detail. If you really want to understand where that memory allocation is coming from, hop over to your iex shell.
In the shell, you can use :sys.get_state/1 to get the state of a GenServer. The process you care about is likely a GenServer and, unless it has a big message queue, the memory consumption you're concerned about is probably in its state.
To get a shell on your remote Erlang node you can jump over there from your local shell. Once logged in, you need to create a PID literal to pass to :sys.get_state/1. You'll be tempted to take the PID as you see it in observer and do this:
:c.pid(11972, 14658, 0)
But then you'll hit this issue:
** (ArgumentError) errors were found at the given arguments:

* 1st argument: not a textual representation of a pid

:erlang.list_to_pid('<11972.14658.0>')
Why's this? Because the first number in a PID's address is the number of the node. You booted Observer in your local shell on your local node. Your local node always has address 0. It assigned 11972 to the remote node in this example.
Now that you're on the remote node, the address of this PID is prefixed with a 0!
(iex)> :c.pid(0, 14658, 0)
#PID<0.14658.0>
Great. Now you can pipe that pid to :sys.get_state/1 and see a full dump of the GenServer's state.
Message queue length
As we discussed, the message queue is a process' mailbox. When one process sends a message to another, that message is copied into the receiving process' message queue. Most message sending happens synchronously (i.e. via GenServer.call/2). So, when one GenServer calls another, it blocks until it receives a reply.
If a process is "backed up" with a large message queue, that's an indication of a bottleneck. Ideally, any GenServer that's expected to field messages should be immediately responsive. All I/O or CPU intensive work in your system should be pushed to the edges, to GenServers or Tasks that are dedicated to working and don't need to answer to other GenServers. Seeing even a few messages in a process' queue may warrant reconsidering your system design.
Process memory usage
Sequin didn't have any processes that had an outlier count of reductions. "Message queue length" helped us fix a couple situations where a process was overwhelmed with requests.
But our biggest improvement was minimizing process memory.
As an immutable language, Elixir manipulates lists and maps efficiently. For example, suppose you've instantiated one variable as a list items. If you create a new variable with items as its tail – something like ["head" | items] – it'll embed a reference to items without copying it.
Processes, however, don't share memory between each other. This makes sense; among other things, doing so would make garbage collection much more difficult.
When one process sends a message to another, that message is inserted into the receiving process' message queue. That message queue is located inside the receiving process' process heap. Therefore, the message – and all variables inside of it – is copied.
This means you should be mindful about passing around your large data structures.
Our codebase has several instances of the process pool pattern where a primary GenServer relies on a pool of worker processes to do I/O work. We made two big improvements in our implementation of this pattern:
First, we had instances where every time a worker received a new job, it also received a data structure that could get large (tens of megabytes) but that didn't change between jobs. Every time the worker grabbed a job, it re-copied that unchanged data into its heap. Instead, we could have the worker receive the data structure on its first run, then never receive it again.
Second, we passed one particularly large data structure from a manager to a pool of dedicated worker processes. This meant we were reincurring the memory cost of this data structure for each worker process. We couldn't eliminate the repetition, but reducing the data to its bare essentials before passing it down to the workers minimizes that cost.
For the astute: No, using something like ETS would not resolve this memory-sharing problem. When a process retrieves data from ETS, that data too is copied into its process heap.
Recap
After running our investigation with Observer and performing some optimizations, we have a better handle on our system's runtime properties and how to introspect them.
We used a combination of the run queue and scheduler utilization to confirm our machine was overloaded and at scale. Then we used the "Processes" tab to identify process bottlenecks. We optimized our process memory overhead and rearchitected processes that were occasionally overloaded by messages.
We're feeling well-equipped for the next time. I hope you do too!
Join the discussion: https://news.ycombinator.com/item?id=32566891
Appendix A: Running Observer
Ready to try out Observer yourself?
While Observer does come with a CLI tool that's easier to run in production, I think it's worth it to do a little more work to get Observer running in its GUI.
One of the killer features of Elixir/the BEAM is the ability to connect two nodes on separate machines. When two nodes are connected, a process from one node can send a message to a process in another node.
We can use this feature to run a local instance of Observer that's connected to a remote node.
To pull this off, we use this great little script which focuses specifically on a remote Elixir node running inside a docker container. The basic idea:
- The script boots a local instance of iex (Elixir's REPL).
- The script opens an SSH tunnel between your machine and the machine running your Docker container.
- In the machine running your Docker container, the script runs a
docker execcommand that instructs the node to connect to your local instance of iex.
Once the two are wired up, you can simply run :observer.start in your local REPL to boot Observer. It will default to showing you stats for your local iex Node. In the menubar at the top, you'll select "Nodes" then your production Node.
Here's a grab-bag of other notes for this setup:
* If you're using a bastion host, be sure to setup your local~/.ssh/configproperly. You should indicate that you want to use the bastion for all connections to your instances.
* Be sure not to skip theGatewayPortsinstructions in the README for the script. If you're running on EC2, after you edit theGatewayPortsconfig, you can runservice sshd restartto restart ssh.
* You'll need to make sure your Docker container has an open port forepmd(defaults to4369).
* You'll need to setup theERLANG_COOKIEwith a strong token in your environment.
Appendix B: Starving the system
While measuring and optimizing, we ran an experiment that allowed the team to shape our mental model of processes and schedulers with a real-world example operating at the limits.
We have one codepath that is called frequently but is very CPU intensive. We were curious what would happen if we parallelized the process using Flow. Flow is an Elixir library that makes it easy to create data pipelines that fan units of work out into processes. So the same amount of work would be completed, but it would be chunked and processed in parallel.
The result? The operation ran much faster. But, the rest of the system suffered. The graph for the execution time of the operation plummeted, but the graphs for latency in other parts of the system climbed in kind.
We quickly figured out what was happening: This operation, with its massive parallelization, was starving the rest of the system. Imagine that our already-overloaded scheduler was originally in charge of distributing work among 10 processes that each needed CPU time. Then this operation starts. Without Flow, this operation would be a single process. With Flow, it spins up to a total of 10 processes. That means 20 processes that each need CPU time. The scheduler round-robins execution time between these processes. Because 10 of those processes are dedicated to the operation, the operation gets 50% of the core's air time!
Flow shines when you're running a CPU- or IO-intensive task and have cores on your machine to spare. But use caution if operating at the limits or if the task is running constantly. You may end up over-allocating resources towards it.

